The X4 BPMS offers different views. Some of the available views are only available in certain perspectives.
Opening views
No further views can be opened in the BPMN Designer perspective, as all relevant views are opened by default.
-
Select the desired view from the View menu in the menu bar.
|
|
Projects |
The Projects view displays a tree structure of the connected repository with various elements such as projects, folders, and files. You can access the context menu by right-clicking an element. Depending on where you are in the tree structure, the options in the context menu change. Use the Filter text field above the project tree to search for files within the connected repository. Placeholders such as You can perform the following actions using the toolbar of the Projects view:
|
|---|---|---|
|
|
Apps |
The Apps view displays all X4 apps that are used to bundle projects. |
|
|
Properties |
In the Properties view, you can view and edit the properties of selected process components and open processes.
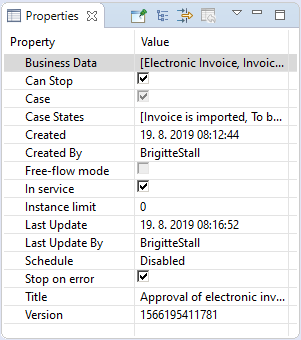
By default, the most common properties are displayed. However, you can make additional settings using the toolbar of the Properties view:
|
|
|
Run/Debug Console |
When a process is checked for errors or simulated, debug information is displayed for each executed process step in the Run/Debug Console view. Error messages are highlighted in red, and successful status messages are highlighted in green. If a process step returns an intermediate result, it is stored in a temporary file during debugging, which you can view via the corresponding reference (for example, file://1376054979039/). |
|
|
Output |
You can access the Output view during debugging via the Debug > Output menu or via the In the Output view, you can view the results of each individual debug step. 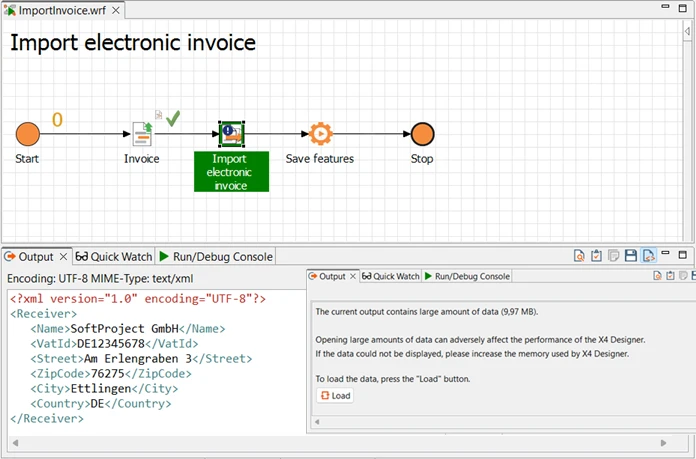
If the output data is greater than 1 MB, a warning is displayed. You can download the data via a button.
You can execute the following actions using the context menu:
Note: Binary data is output as hexadecimal data in the Output view. Images and text-based content are output as images or text. The output of binary data as hexadecimal data does not affect the performance of the X4 Designer. |
|
|
Web App Preview |
The Web App Preview view opens automatically when you open the Web App perspective. In the Web App Preview view, you can find a live preview of the opened Detail component. |
|
|
Server Log |
In the Server Log view, you can track the server status and, in particular, errors in the server log from the X4 Designer. 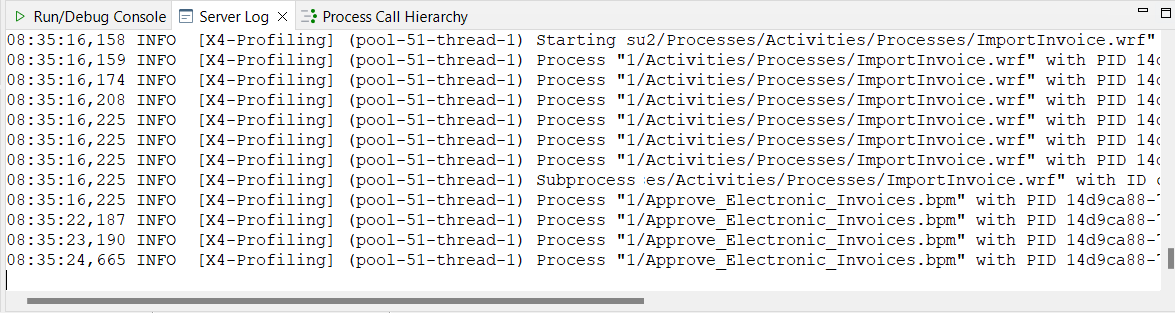
|

|
Process Call Hierarchy |
In the Process Call Hierarchy view, you can display which respository elements use a process or process component in the respository. 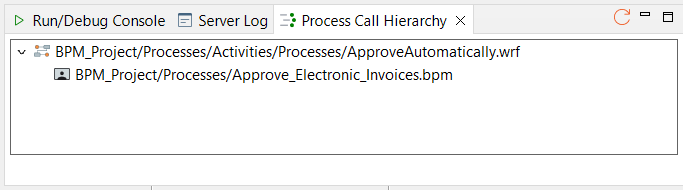
If you right-click an element in the Projects view, a context menu is displayed. With Process Call Hierarchy, a list of all repository elements that contain at least one reference to the selected element is displayed. |
|
|
Error Log |
In the Error Log view, you can view errors that have occurred in the X4 Designer. 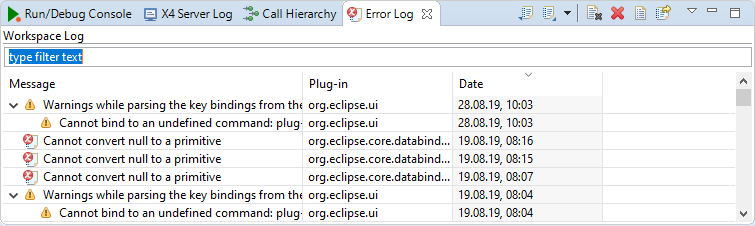
You can execute the following actions using the context menu:
|
|
|
Problems |
All errors and warnings are listed in the Problems view. You can customize the list of problems using the filter icon. |
|
|
Debug Sessions |
All active debug sessions are listed in the Debug Sessions view. Double-click a process in the Debug Sessions view to switch to the associated debug session. Active debug sessions are grayed out. New debug sessions associated with the server are highlighted in orange. |
|
|
Breakpoints |
All set breakpoints are listed in the Breakpoints view. You can enable, disable, and delete breakpoints. You can also skip all breakpoints without deleting the breakpoints. |
|
|
Quick Watch |
You can access the Quick Watch view during debugging via the Debug > Quick Watch menu or by clicking the Unknown AttachmentQuick Watch icon in the toolbar. In the Quick Watch view, you can view variables, parameters, and dynamic parameters with their values separately during debugging. To do this, select the appropriate entry from the drop-down list: 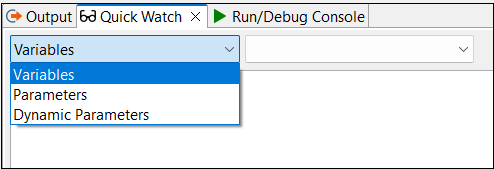
Selected variables are updated after each debug step. When you select the Parameters entry, you can use the Project, Global, and System checkboxes to specify which parameters you want to display: 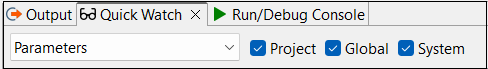
If the result contains content larger than 1 MB, a warning is displayed and you can download the result by clicking a button.
|
|
|
Outline |
The complete process diagram is displayed as an illustration in the Outline view. You can click on individual areas in the image to easily navigate the process, even if the image is larger than the designer window. |
|
|
Base64 |
Encode or decode Base64 strings |
|
|
Digest |
Create a hash value for strings |
|
|
Regex |
Apply a regular expression (Regex) to a string to test the expression or to directly replace the string according to a pattern |

|
URLCodec |
Encode or decode URL strings |
More information: