A bar chart can be used to compare multiple variables to a single value. They are useful for comparing categories.
A bar chart can contain the following elements:
-
<Bar>: Contains all the elements that belong to the bar chart. Specifies how the chart should be displayed. -
<BarData>: Defines how the data are displayed. A<BarData>element must be defined for each category in the bar chart. -
<Axis>: Defines the axis labels. -
<Tooltip>: Defines how the tooltip for each value should be displayed in the chart.
General attributes
The following attributes are available for all elements of a bar chart:
|
Attribute |
Description |
|---|---|
|
|
Specifies the font family.
Possible values:
|
|
|
Sets the font size.
Possible values:
|
|
|
Defines the width of each character. This attribute overrides the default character width for this layout. Possible values:
This attribute does not work for the |
|
|
Defines the tilt of the font. This attribute overrides the default font tilt for this layout. Possible values:
This attribute does not work for the |
|
|
Defines the font weight. This attribute overrides the default font weight for this layout. Possible values:
This attribute does not work for the |
|
|
Defines the font color. This setting overrides the default color of the color scheme!
|
Bar
<Bar> : Contains all the elements that belong to the bar chart. Specifies how the chart should be displayed.
In addition to the general attributes, <Bar> can have the folllowing attributes:
|
Attribute |
Description |
|---|---|
|
|
Specifies whether to display a legend. Possible values: |
|
|
Specifies whether the bar chart should be displayed as a stacked chart.
Possible values: |
BarData
<BarData> : Child element of <Bar> . Defines how the data are displayed. A <BarData> element must be defined for each category in the bar chart.
In addition to the general attributes, <BarData> can have the following attributes:
|
Attribute |
Description |
|---|---|
|
|
Specifies which Possible values: Data binding possible |
|
|
Color of the bar Possible values: Hexadecimal color value or expression for data binding (Color) If the |
|
|
Specifies which data object of the data source is visualized. Possible values: Data binding possible |
|
|
Specifies the name of the data displayed in the legend. Possible values: Any string or data binding |
|
|
Specifies which value of the data object is visualized. Possible values: Data binding possible |
Axis
<Axis> : Child element of <Bar> . Defines the axis labels.
In addition to the general attributes, <Axis> can have the following attributes:
Tooltip
<Tooltip>: Child element of <Bar> . Defines how the tooltip for each value should be displayed in the chart.
For <Tooltip> , you can define the general attributes (see above).
Emptying data
If you reload additional data using a process, the previously loaded chart will not be removed. If you want to overwrite the previously loaded chart with the new data, the empty="true" attribute must be declared in the data. The attribute clears the existing data.
Input 1
Example 1:
<?xml version="1.0" encoding="UTF-8"?>
<Ok>
	<b2 empty="true"/>
	<b1>
		<a>1</a>
		<b>1</b>
	</b1>
</Ok>
Input 2
Example 1:
<?xml version="1.0" encoding="UTF-8"?>
<Ok>
	<b1 empty="true"/>
	<b2>
		<a>1</a>
		<b>1</b>
	</b2>
</Ok>
Chart in the component
Example 1:
<Chart>
	<Bar>
		<BarData
			category="#a"
			data="#b1"
			value="#b" />
		<BarData
			category="#a"
			data="#b2"
			value="#b" />
	</Bar>
</Chart>
Examples
Example 1:
<Properties>
<Property name="DataSource" type="Complex">
<Property name="CompanyX" type="List">
<Property name="Category" type="String"/>
<Property name="Money" type="Integer"/>
</Property>
<Property name="CompanyY" type="List">
<Property name="Category" type="String"/>
<Property name="Money" type="Integer"/>
</Property>
</Property>
</Properties>
<FlowLayout>
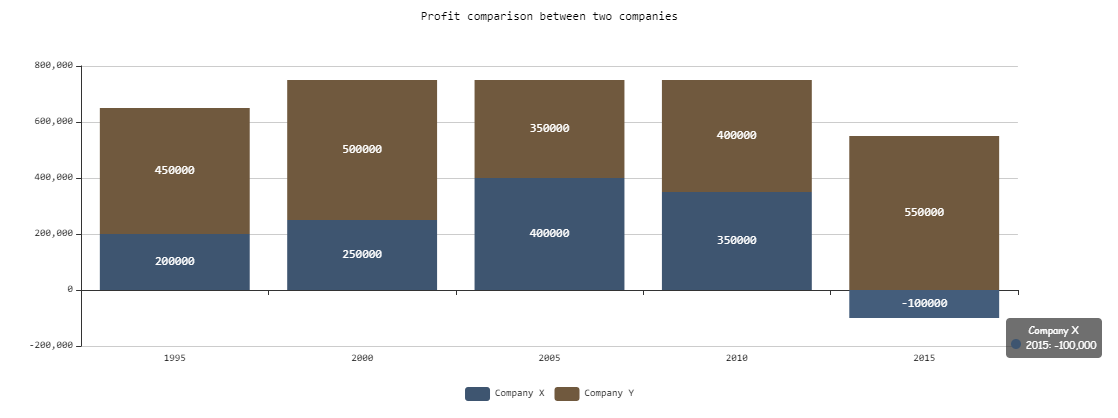
<Chart fontFamily="Font03" title="Profit comparison between two companies">
<Bar stacked="true">
<Tooltip fontFamily="Font02" fontSize="10"/>
<Axis fontFamily="Font03" fontSize="10"/>
<BarData category="#Category" data="#DataSource.CompanyX" fontFamily="Font03" name="Company X" value="#Money"/>
<BarData category="#Category" data="#DataSource.CompanyY" fontFamily="Font03" name="Company Y" value="#Money"/>
</Bar>
</Chart>
</FlowLayout>
The example above results in the following chart:
Example 2:
<Property name="Datasource" type="Complex">
<Property name="Bar1" type="List">
<Property name="category" type="String"></Property>
<Property name="value" type="Integer"></Property>
</Property>
<Property name="Bar2" type="List">
<Property name="category" type="String"></Property>
<Property name="value" type="Integer"></Property>
</Property>
<Property name="Bar3" type="List">
<Property name="category" type="String"></Property>
<Property name="value" type="Integer"></Property>
</Property>
...
...
...
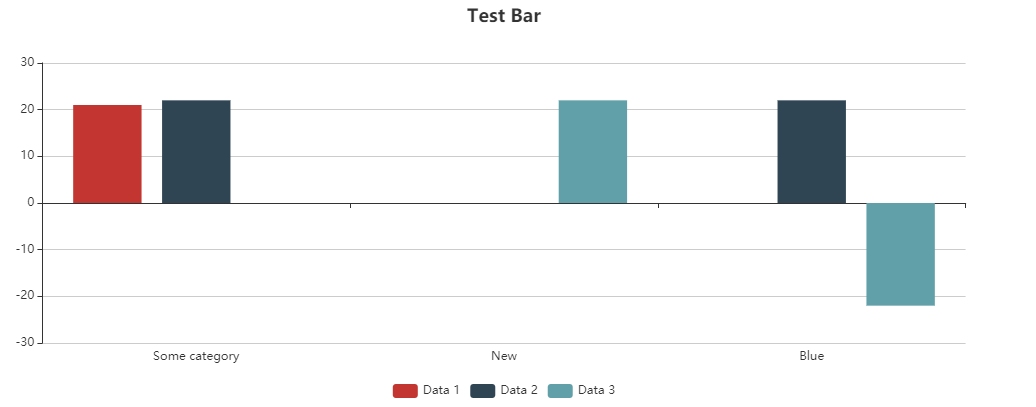
<Chart title="Test Bar">
<Bar>
<BarData data="#Datasource.Bar1" category="#category" value="#value"
name="Data 1" />
<BarData data="#Datasource.Bar2" category="#category" value="#value"
name="Data 2" />
<BarData data="#Datasource.Bar3" category="#category" value="#value"
name="Data 3" />
</Bar>
</Chart>
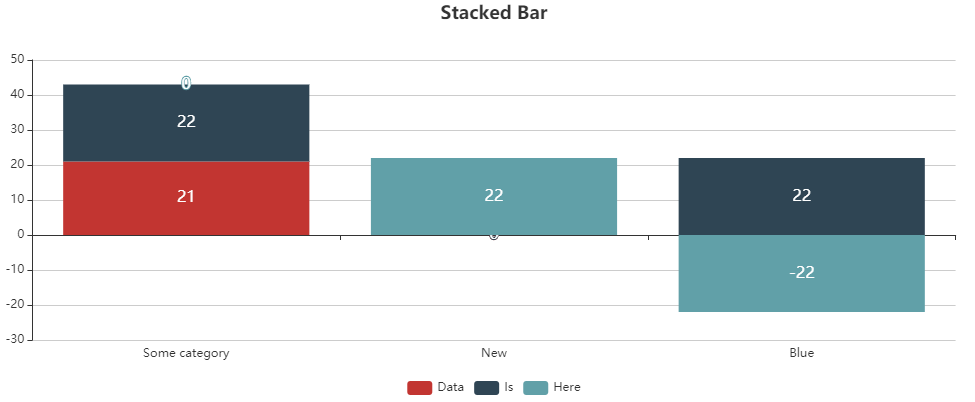
<Chart title="Stacked Bar">
<Bar stacked="true">
<BarData data="#Datasource.Bar1" category="#category" value="#value"
name="Data 1" />
<BarData data="#Datasource.Bar2" category="#category" value="#value"
name="Data 2" />
<BarData data="#Datasource.Bar3" category="#category" value="#value"
name="Data 3" />
</Bar>
</Chart>
The <BarData> element is used to represent a category in the chart. The displayed data itself is contained in the Datasource property. The example above results in the following chart: