A gauge chart can be used to show states with different valuations. It is well suited to compare target/actual values, e.g. for key figures, customer satisfaction or quality measurements.
A gauge chart can contain the following elements:
-
<Gauge>: Defines how the diagram is displayed. -
<Tooltip>: Defines how the tooltip for the single values within the chart is displayed.
General Attributes
The following attributes are provided for all elements of a gauge chart:
|
Attributes |
Description |
|---|---|
|
|
Defines the font family.
Possible values:
|
|
|
Defines the font size.
Possible values:
|
|
|
Sets the width of the single characters.
This attribute overrides the default width of the characters of the Web App for this control.
Possible values:
This attribute doesn't work with the
|
|
|
Defines the font style.
This attribute overrides the default style of the characters of the Web App for this control.
Possible values:
This attribute doesn't work with the
|
|
|
Defines the font weight.
This attribute overrides the default font weight of the Web App for this control.
Possible values:
This attribute doesn't work with the
|
|
|
Defines the font color.
This setting overwrites the default color of the color scheme!
Possible values:
Do not use a hash in front of the color value! Do not use a shortened notation of the color value!
|
Gauge
<Gauge>: Defines how the diagram is displayed.
In addition to the general attributes, <Gauge> can have the following attributes:
|
Attribute |
Description |
|---|---|
|
|
Defines the end range of the gauge chart in percent. The color of the area is defined within the Theming Editor via the color property Possible values: Integer between The default values (
|
|
|
Defines the middle range of the gauge chart in percent. The color of the area is defined within the Theming Editor via the color property Possible values: Integer between |
|
|
Defines the initial range of the gauge chart in percent. The color of the area is defined within the Theming Editor via the color property Possible values: Integer between |
|
|
Defines the endpoint of the gauge chart. Possible values: Integer between
|
|
|
Defines if a legend is displayed. Possible values: |
|
|
Defines the maximum value of the gauge chart. Possible values: Integer (default: |
|
|
Defines the minimum value of the gauge chart. Possible values: Integer (default: The connection from
|
|
|
Defines the start point of the gauge chart. Possible values: Integer between For this setting, the following integers correspond to the following positions on a clock face:
|
|
|
Defines which value of the data object is visualized. Possible values: Any string or Data Binding |
Tooltip
<Tooltip>: Child element of <Gauge>. Defines how the tooltip for the single values within the chart is displayed.
For <Tooltip> the general attributes (see above) can be defined.
Examples
<Properties>
<Property name="DataSource" type="Complex">
<Property name="Satisfaction" type="Integer"/>
</Property>
</Properties>
<FlowLayout>
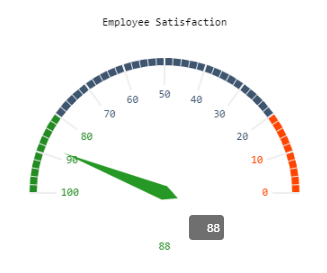
<Chart fontFamily="Font03" title="Employee Satisfaction">
<Gauge max="0" min="100" value="#DataSource.Satisfaction">
<Tooltip fontFamily="Font02" fontSize="12"/>
</Gauge>
</Chart>
</FlowLayout>
The above example creates the following diagram:
<Property name="Datasource" type="Complex">
<Property name="gauge" type="Integer"/>
...
...
...
</Property>
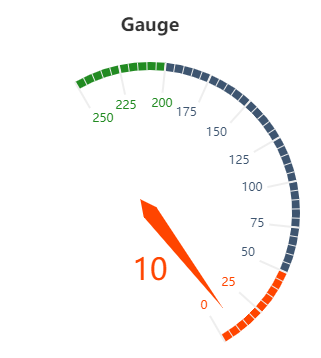
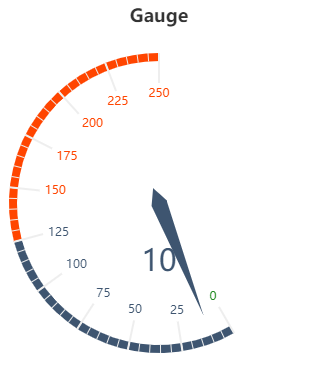
<Chart title="Gauge">
<Gauge value="#Datasource.gauge" min="0" max="250" startAngle="-60" endAngle="-270" axisMin="0" axisMiddle="50" />
</Chart>
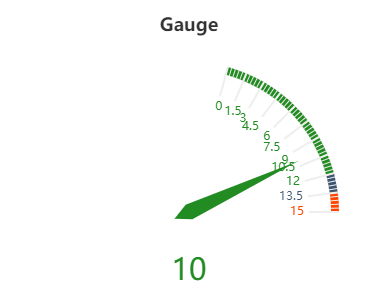
<Chart title="Gauge">
<Gauge value="#Datasource.gauge" min="0" max="15" startAngle="75" axisMin="80" axisMiddle="90" />
</Chart>
<Chart title="Gauge">
<Gauge value="#Datasource.gauge" min="-1" max="250" startAngle="120" />
</Chart>
The above example creates the following diagrams:
Functionality and further examples for gauge charts
The following must be observed for gauge charts:
-
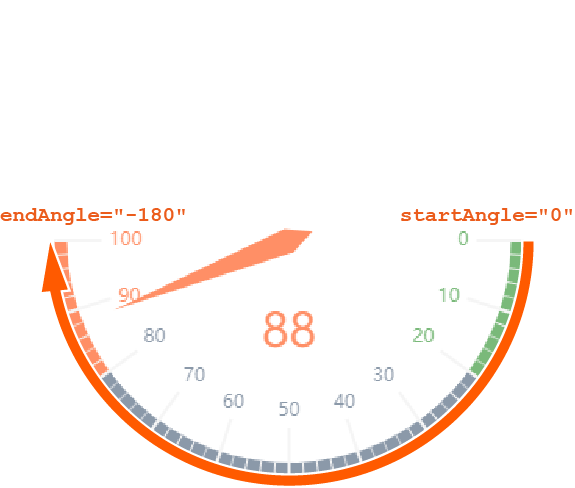
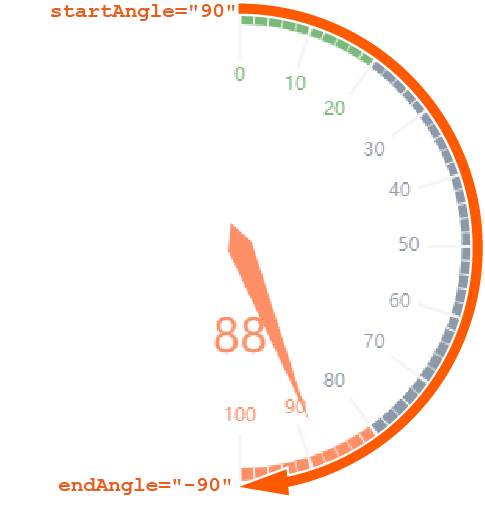
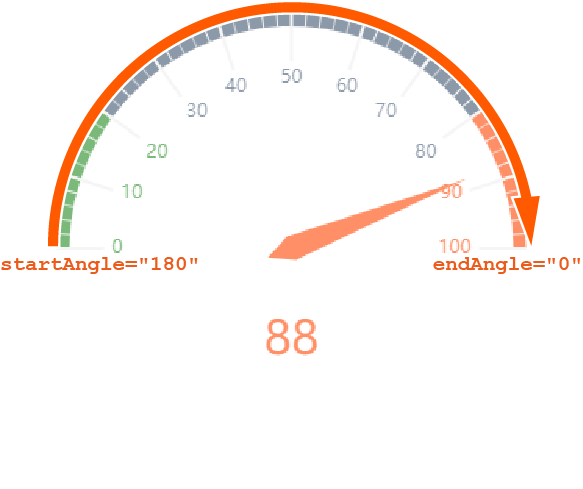
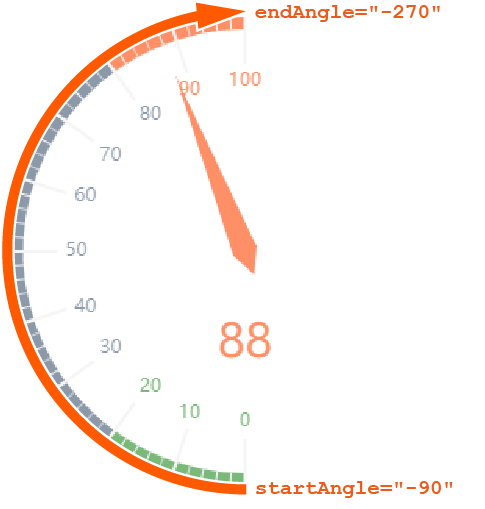
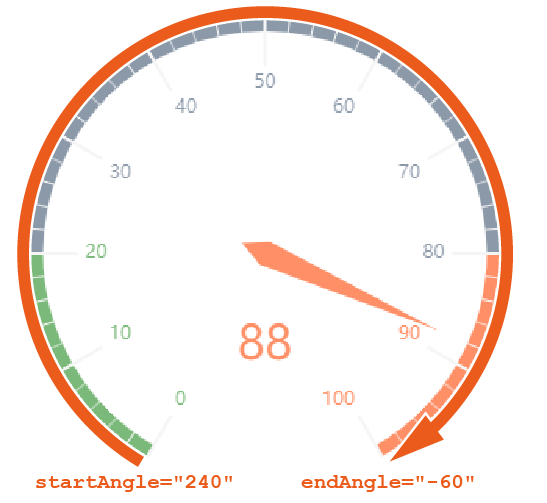
endAnglemust be smaller thanstartAngle. -
The connection from the start angle to the end angle is always clockwise.
-
The connection from
mintomax(scale) is always clockwise.
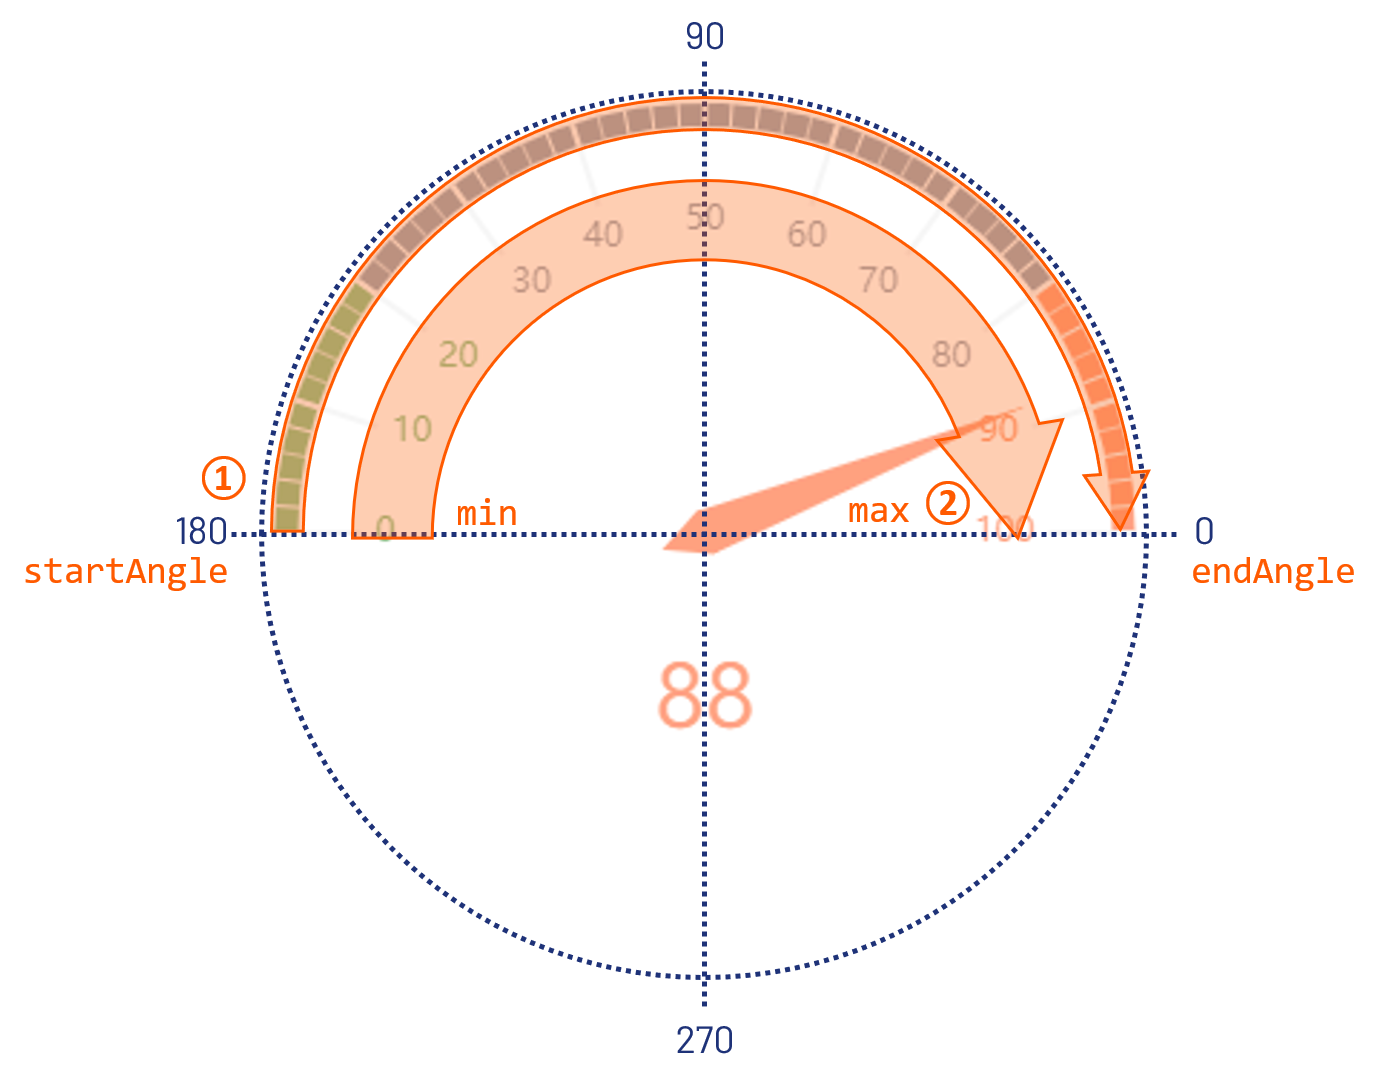
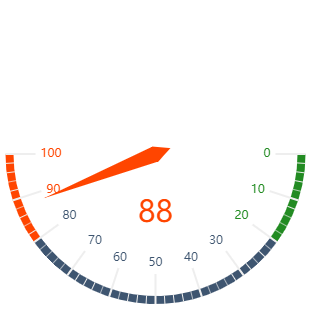
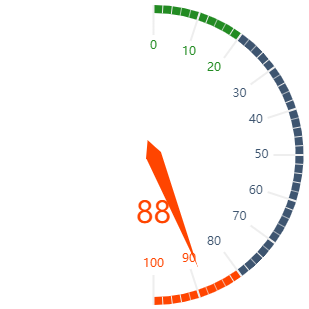
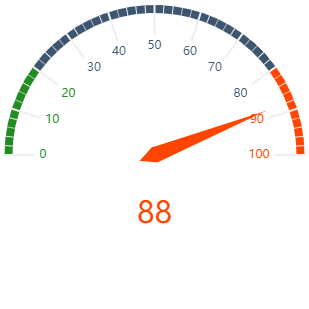
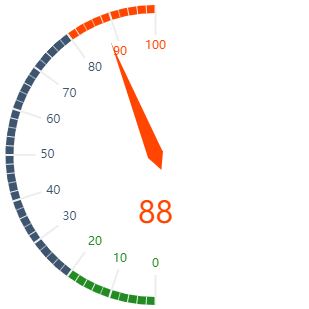
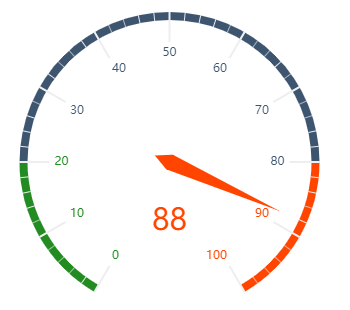
The following are further examples of gauge charts with explanations to illustrate how the start and end angles work.
|
Definition |
Result |
Explanation |
|---|---|---|
|
|
|
|
|
|
|
|
|
|
|
|
|
|
|
|
|
|
|
|