Profiling
By default, all execution information of the processes is logged using a profiling mechanism. If you do not want this logging to be performed by default, you can add a profiling file (.profiling) to your project. You can configure the profiling in this file, e.g. by excluding specific processes from the profiling.
There are two methods to store profiling information:
Profiling with in-memory persistence
This profiling method uses an in-memory persistence to store the profiling information. This means that all information is lost when the X4 Server is shut down. If the memory is full the oldest entries will be deleted automatically.
If you use this profiling method, all profiling information is stored in log files. The following types of log files are available:Log File
Description
X4 Server Log By default, this log file is displayed in the server console.
The sub-string containing
debug mode <false|true>must be displayed for each process execution.Example:
11:41:46,796 INFO [X4-Profiling] (pool-43-thread-1) Process "1/ProfilerAdapterSprintReview/Processes/ProcessInformation.wrf" with PID 3cb216e3-0b44-4e1f-92c4-b0431755ed82 finished, with debug mode 1, with status false after 5011msX4 Profiling log file in the file system This log file is available in the file system in the wildfly\standalone\log\profiling.log folder and can be used as a fallback in case the server log fails.
In order to enable this log file you must uncomment the configuration block in lines 90 to 136 in the standalone.xml file in the wildfly\standalone\configuration\ folder.
When the server is restarted the latest information from the log files is reloaded into the memory. Thus, the in-memory profiling of the latest process is always available and accessible.
Profiling using the SQL profiling plug-in
Note
When using the Process Monitoring App, the profiling via the SQL Profiling plug-in is the recommended profiling method for use cases including a large number of processes which cause a high server load.
Note:
You can request the SQL Profiling plugin from our support team on the SoftProject website under Resources > X4 Downloads. Go to the desired X4 BPMS version and on the X4 Add-ons tab, select the Request button next to the plugin description.
The SQL Profiling plugin is used to store profiling data into a relational SQL database. To do so, you need to connect the SQL Profiling plugin to a relational SQL database. The plugin has to be activated in the
module.xmlfile in the<server_directory>\wildfly\modules\de\softproject\plugins\mainfolder.The first start of the profiling must be executed by a database user who has the permission to create database tables. After all tables required have been created, a user with fewer permissions can take over.
When you enable the SQL Profiling, the default profiling in the memory is turned off.
How to install the plugin
Unpack the ZIP file with the plugin.
Copy the
sql-profilingfolder to thede\softproject\x4\plugins\folder.Open the
module.xmlfile in the<server_directory>\wildfly\modules\de\softproject\x4\plugins\sql-profiling\mainfolder.Copy the plugin name specified in line 2:
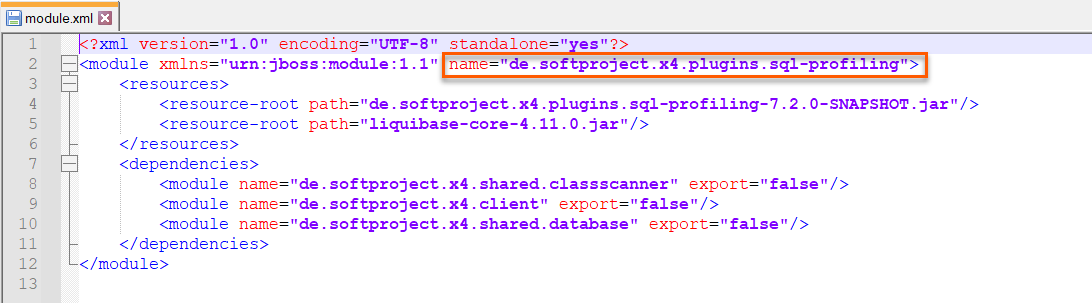
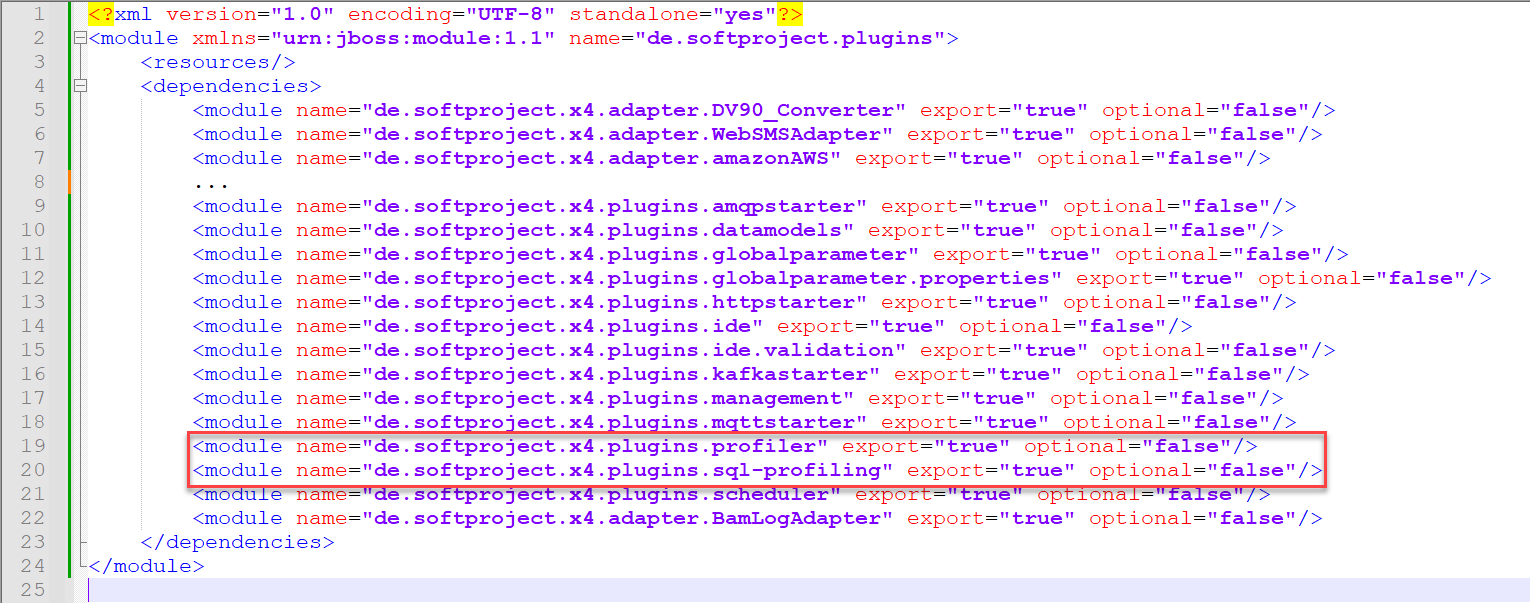
Open the
module.xmlfile in the folder<server_directory>\wildfly\modules\de\softproject\extensions\main.Add the following line to the
module.xmlfile:The file content should look like this:
Restart the X4 Server.
After restarting the X4 Server, the plugin will be available.
How to configure SQL Profiling
In the
<server_directory>/configurationsfolder, create thesql_profiling_config.xmlfile.Insert the following content.
XML<?xml version="1.0"?> <Configuration> <DatabaseConfiguration> <ConnectionString>JDBC-CONNECTION</ConnectionString> <UserName>USERNAME</UserName> <Password>PASSWORD</Password> <MaxPoolSize>36</MaxPoolSize> <MinPoolSize>8</MinPoolSize> <InitialPoolSize>24</InitialPoolSize> <!--OPTIONAL--> <AdditionalConnectionPoolConfig> <CheckoutTimeout>20000</CheckoutTimeout> </AdditionalConnectionPoolConfig> </DatabaseConfiguration> <WriteCycleTime> <Duration>10</Duration> <TimeUnit>SECONDS</TimeUnit> </WriteCycleTime> <KeepLogs> <Duration>100</Duration> <TimeUnit>DAYS</TimeUnit> </KeepLogs> <KeepCrashedProcessLogs> <Duration>100</Duration> <TimeUnit>DAYS</TimeUnit> </KeepCrashedProcessLogs> <RunCleanUp> <Duration>240</Duration> <TimeUnit>MINUTES</TimeUnit> </RunCleanUp> <FastDeleteEnabled>true</FastDeleteEnabled> <GlobalStepLogging>ALL</GlobalStepLogging> </Configuration>Enter the required values in the
sql_profiling_config.xmlfile.
Database Configuration
Element
Description
Possible values
DatabaseConfigurationWrapper for the database connection
ConnectionStringJDBC connection string for the connection to the database
For more information, see the official JDBC database documentation.
Connection URL for the JDBC database
UserNameUser name for the login to the database
Any string
PasswordPassword for the login to the database
Any string
MaxPoolSizeMaximum pool size of the connection pool.
Recommended value: 15
Integer
MinPoolSizeMinimum pool size of the connection pool.
Integer
InitialPoolSizeInitial size of the connection pool.
Recommended value: 8
Integer
AdditionalConnectionPoolConfigAdditional settings to the underlying connection pool.
TheCheckoutTimeoutelements how long a client will wait for a connection in milliseconds.0is default and means the client will wait indefinitely for a connection.For more information, see: https://
https://www.mchange.com/projects/c3p0/#configurationInteger
WriteCycleTimeSpecifies the cycles in which data is written to the SQL database.
Data is only written to the database for the selected write cycle (WriteCycle). If the server crashes within the cycle, the unwritten data is lost.
The element contains the following elements:
DurationTimeUnit
KeepLogsSpecifies how long entries are stored before they are cleared automatically.
The element contains the following elements:
DurationTimeUnit
KeepCrashedProcessLogsSets the period of time for which entries for crashed processes are stored before they will be cleared automatically.
Crashed processes are not covered by the
KeepLogselement.The element contains the following elements:
DurationTimeUnit
RunCleanUpSets the cycles in which the automatic cleanup is performed.
The element contains the following elements:
DurationTimeUnit
FastDeleteEnabledDeletes logs in a faster way.
If this is activated, the
KeepCrashedProcessLogsconfiguration has no effect. Any process log that is older than the period defined inKeepLogsis deleted, regardless of whether the process has crashed or not.Possible values:
true(default)false
GlobalStepLoggingDefines which process steps are logged.
Possible values:
ALL: Logs all process steps as before.NONE: Logs no process steps at all.ERROR_ONLY: Logs process steps that finished with an error state.
With
ERROR_ONLY, also steps that ended with negative status numbers will be logged.WriteCycleTime
Element
Description
Possible values
DurationPeriod in which the cached profiling data is written to the database
Integer
TimeUnitUnit of the period of time
SECONDSMINUTESHOURSDAYS
KeepLogs
Element
Description
Possible values
DurationPeriod of time for which the profiling data is to be stored in the database
Integer
TimeUnitUnit of the period of time
SECONDSMINUTESHOURSDAYS
KeepCrashedProcessLogs
Element
Description
Possible values
DurationPeriod of time for which the profiling data about crashed processes is to be stored in the database
Integer
TimeUnitUnit of the period of time
SECONDSMINUTESHOURSDAYS
RunCleanUp
Element
Description
Possible values
DurationPeriod of time after which the automatic clean-up will delete the process logs
Integer
TimeUnitUnit of the period of time
SECONDSMINUTESHOURSDAYS
Note:
You can also access the profiling information displayed in the Process Monitor App via an API.
To do so, you can use the Process Profiler adapter for a process to get all runtime information for a process or a process instance and embed it in your own applications.
Alternatively, you can call the X4 API via localhost:8080 and manage the profiling information in the Profiling Management section at runtime.
This means you can activate the profiling at runtime without having to access the X4 BPMS itself. This is, for example, useful in case of a process for which the profiling is turned off, but you still need information about this process.