Showing Statistics
The Statistics tab contains statistical data, charts, and KPIs for the selected process and process instance on an overview screen.
This screen is divided into three sections:
Section | Description |
|---|---|
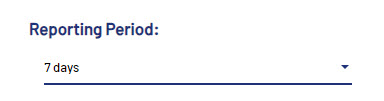
| Select the period for which the statistical data should be calculated. Available values:
|
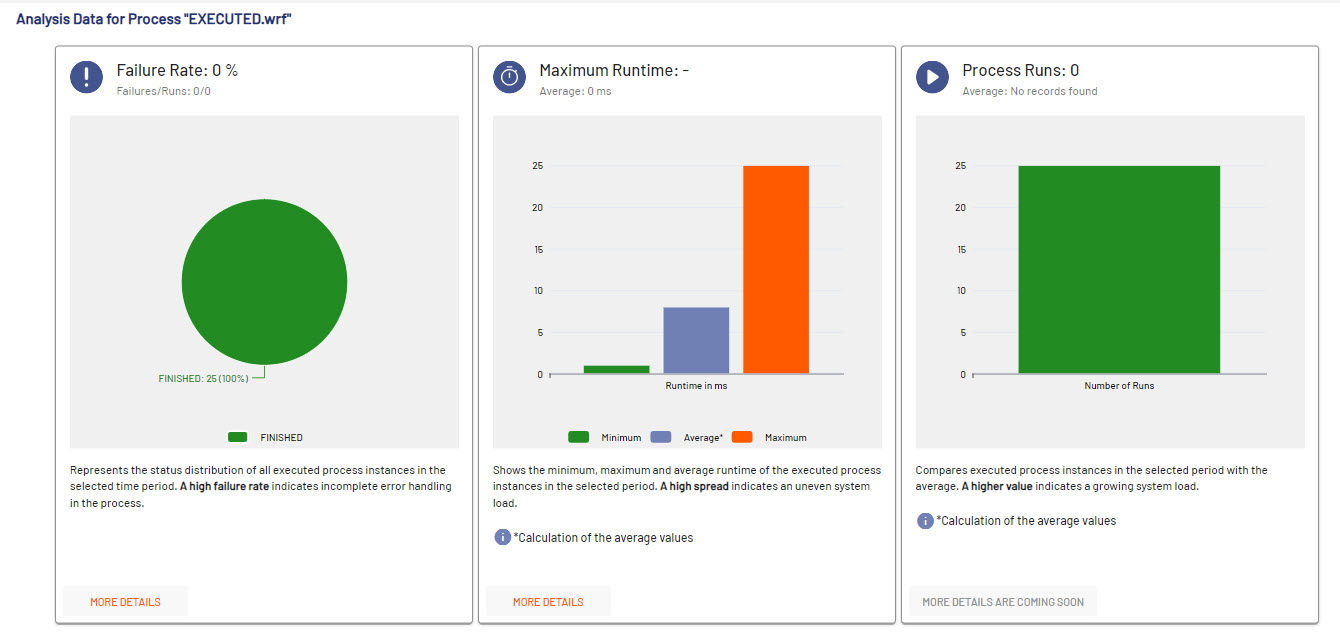
| Shows process-related analysis data like failure rate, maximum runtime and number of process runs. Note: For additional information, select More Details. |
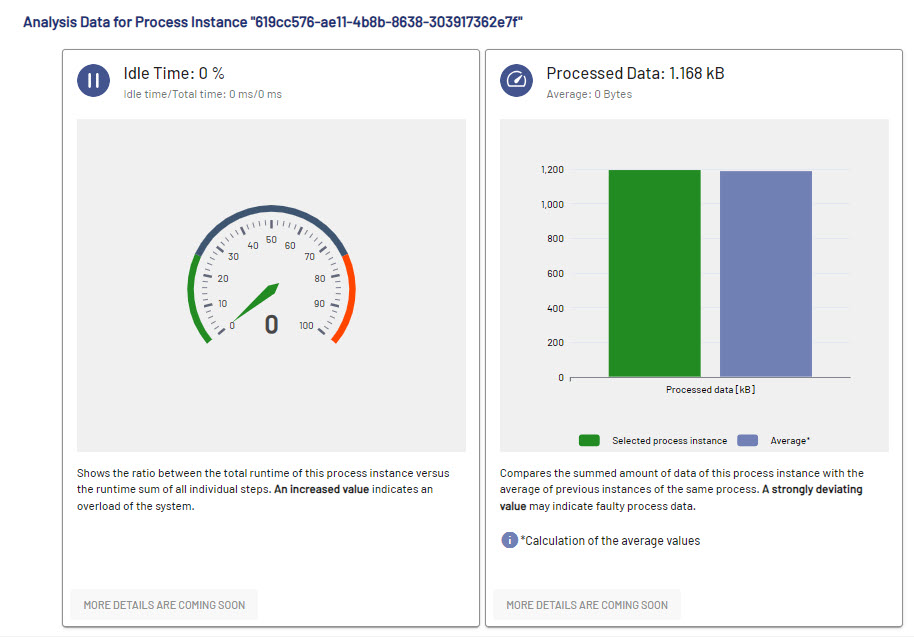
| Displays statistic data and KPIs for the selected process instance on the Idle Time and Processed Data tabs. |