Debugging Processes Including Custom Adapters
When debugging processes that include one or more custom adapters, you proceed the same way as when debugging processes with preconfigured adapters. For more information, see Debugging and Running Processes.
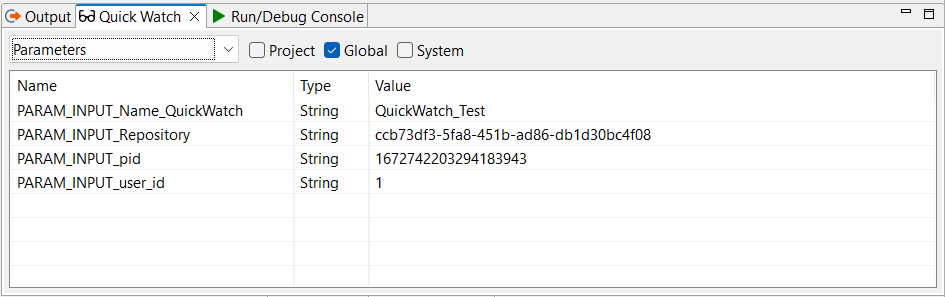
When you debug a process that contains a custom adapter, the Quick Watch view also displays the input parameters of the custom adapter. You can recognize the input parameters by the PARAM_INPUT prefix before the parameter name.
How to display the parameters of native adapters in the Quick Watch view:
- Select Parameters from the drop-down list to display all parameters.
If you want to limit the displayed parameters further, select the corresponding checkbox. For example, select Global to display only global parameters. The input parameters of native adapters belong to the category of global parameters.
Additional information:
- Section Views in the chapter with the description of the X4 Designer Interface
- Section Creating parameters in the chapter Creating and modelling processes