
Configuring the Monitoring of Profiling Data in the Design View
When you configure the monitoring in the Design view, you will see all available settings in the Monitoring Configuration window.
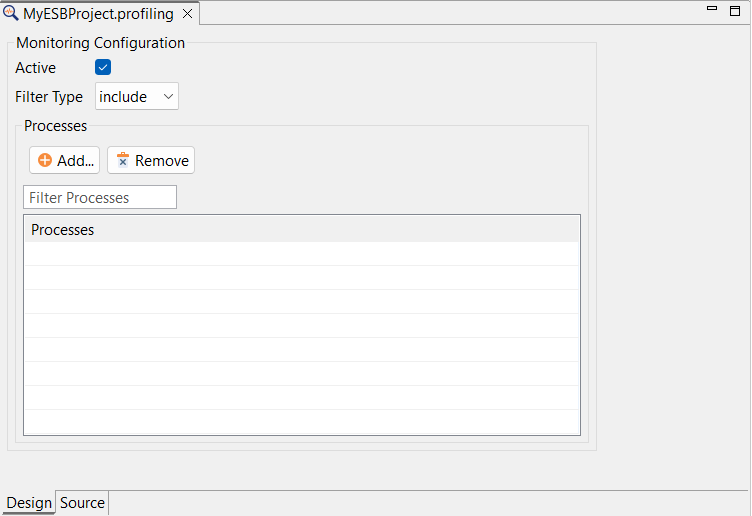
You can make the following settings in the Monitoring Configuration window:
Active checkbox | Use this checkbox to specify whether the logging of processes is enabled or disabled. By default, the checkbox is selected. |
Filter Type drop-down | Use this drop-down list to specify whether the stored processes should be included or excluded from logging. Available options: include: The stored processes are explicitly covered by the logging. exclude: he stored processes are explicitly excluded from the logging. |
Processes pane | In this pane, you can Add and Remove processes. You can also specify filter criteria for added processes. For processes you add here, you can specify whether these processes should be included or excluded from logging. |