During process development, you can check your Technical Processes and under certain conditions also Business Processes for syntactic errors of the single process modules directly in the Process Editor.
Requirements
If required, repository files are linked to process modules.
All mandatory parameters and properties are fully parameterized for all process modules.
For business processes: The business process was not created in free-flow mode.
If desired, set debug breakpoints to automatically stop debugging at critical process steps:
Click the desired process module in the process diagram.
Click Toggle Breakpoint in the toolbar.
Click Start Debugging (F4) to start the debug mode. To start a parallel debug session, select Start Debugging again.
You can start a parallel debug session for all Technical Processes.
In the Debug Sessions view, you can see all active debug sessions. In the Debug Sessions view, double-click the desired Technical Process to switch to the debug session.
Active debug sessions are marked in gray. New debug sessions connected to the server are marked in orange.
Execute the next step.
Click Step Into (F5) to execute and display the next single step. The debugger jumps into subprocesses. Each single step in the subprocess must be executed.
Click Step Over (F6) to execute and display the next single step. The debugger skips subprocesses, but stops when a breakpoint is reached. The result of the subprocess is displayed as output.
Click Step Return (F7) to execute and display all steps in a subprocess to the end or breakpoint. The debugger then jumps to the main process.
Click Resume (F8) to execute and display all steps to the end or breakpoint.
Click Resume without debugging (F10) to stop debugging and execute all steps. Breakpoints are skipped.
Right-click an element in a process. In the context menu, click Run to element to execute and display all steps up to the element or breakpoint. For each executed process step, an entry is displayed in the Run/Debug Console view. Error messages are highlighted in red, successful status messages are green. In addition, a temporary output file is created for each step, which you can view by clicking the corresponding link.
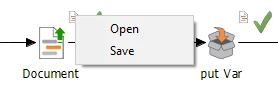
Additionally, the respective output file is attached to the corresponding process component in the process model. The output file can also be saved via the context menu.
If the result contains content larger than 1 MB, a message is displayed and the result can be downloaded via the dialog.
The Output view and Quick Watch view provide additional capability when debugging:
Output: The results of each step can be viewed during debugging; large files can be downloaded via a download button.
Quick: placeholders, dynamic parameters and context variables can be viewed during debugging; large files can be downloaded via a download button.
Both views can be accessed via the Debug > Output or Quick Watch menu or via the respective icons (Output) and (Quick Watch) in the toolbar. For more information, see Views.
With Terminate (STRG+F2) you can end the debug mode manually, if necessary. If a technical error occurs, the debug mode is automatically terminated.
For further information, please visit the following sections:
 Toggle Breakpoint in the toolbar.
 Start Debugging (F4) to start the debug mode. To start a parallel debug session, select
  Step Into (F5) to execute and display the next single step. The debugger jumps into subprocesses. Each single step in the subprocess must be executed.
 Step Over (F6) to execute and display the next single step. The debugger skips subprocesses, but stops when a breakpoint is reached. The result of the subprocess is displayed as output.
 Step Return (F7) to execute and display all steps in a subprocess to the end or breakpoint. The debugger then jumps to the main process.
 Resume (F8) to execute and display all steps to the end or breakpoint.
 Resume without debugging (F10) to stop debugging and execute all steps. Breakpoints are skipped.
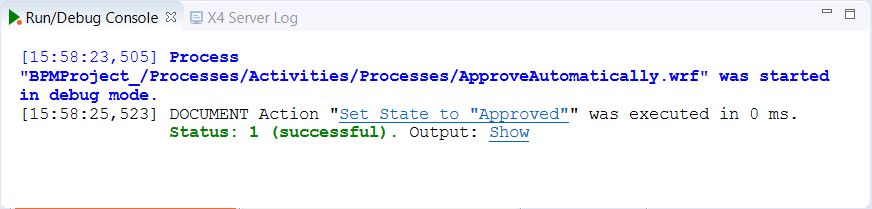


 Terminate (STRG+F2) you can end the debug mode manually, if necessary.